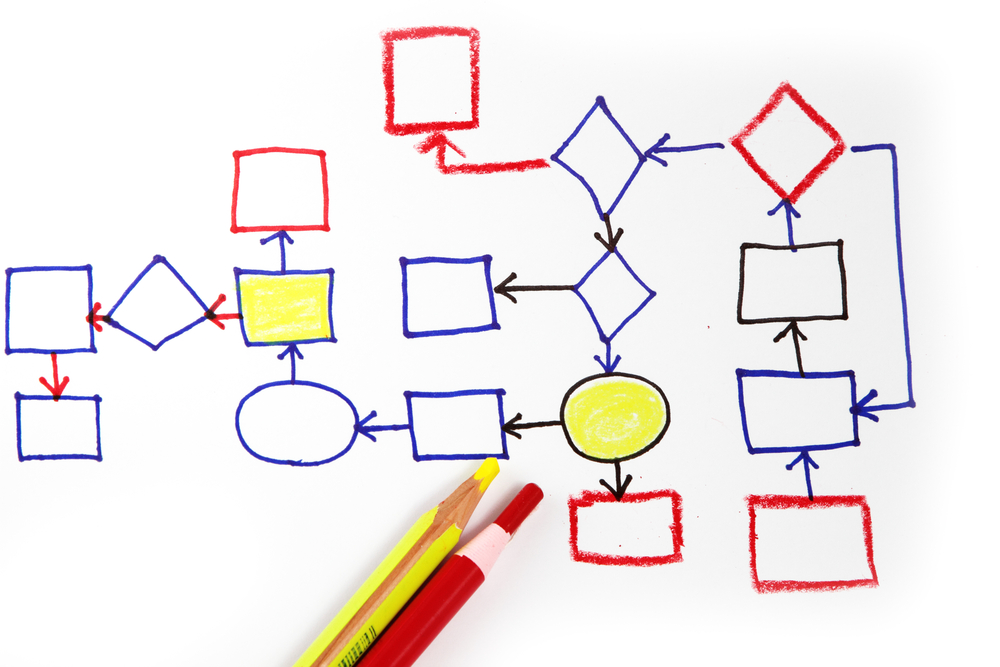
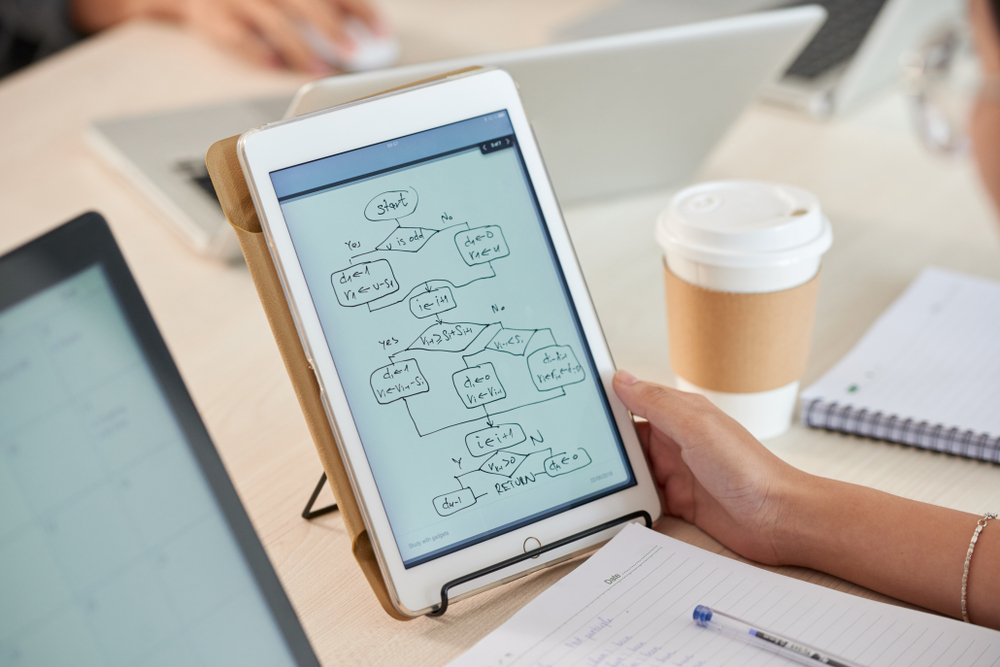
There is no single way to map processes. Why Map a Process? Maps and flowcharts visualize at least some aspects of work. Why is Process Mapping important? It provides an opportunity to learn, standardize, and improve the processes.
Process maps can be used in various ways like: onboarding new employees, organizing work, showing employees roles, identifying new opportunities and measuring performance.

5 ways to get the information needed to create a process map
- Self- generate: if you have firsthand knowledge, then a quick draft can be made.
- One-on-one interview: the interviewer should be an expert and be able to freely discuss the project
- Group facilitation: this requires the same skills as a one on one interview but is a great way of interacting with suppliers, performers and customers.
- Content review: it is a good way to compile and organize documents in one place so the workgroup has access to them.
- Observation: everyone in the natural work group observes the end-to-end workflow to apply what they have just learned as part of all map creation work sessions.
| Level of Performance | Map Used | “View” of Work Emphasized |
|---|---|---|
| Organization | Relationship Map | Organization: The supplier-customer relationships that exist between “parts” of an organization |
| Process | Cross-functional Process Map (CFPM) or Swimlane Diagram | Workflow: The path of work that “crosses” several functions, plus the architecture that connects the relevant activities, people, information systems, and other resources along that path |
| Job /Performer | Flowchart | Activity: The value-creating or non-value-creating work performed |
A relationship map shows parts of an organization and those parts interaction with suppliers and customers. The purpose of a relationship map is to highlight key entities in the organizational processes as well as to depict the existence of relationships between entities. These kinds of maps show the big-picture view of major functions of the business, interactions between functions, and individual functions.
A Cross-Functional Process Map shows the relationship between work done in each part and the functional parts. Each swim lane is representative of a person, team, or stakeholder, making it clear who is responsible for which stage in the process to help avoid confusion.
A Flowchart shows the work with more detail and it features value-creating activities as well as wastage and also the missing pieces can be seen easily. To map a flowchart one should know the meaning of symbols used in it, and know to what extent the symbols should be used to not make it complicated and at the same time show values and where wastes will be in the process. In a nutshell, flowcharts provide a summary outline and overall description of the process.
A map should show the boundaries of each map. Boundaries act as interfaces between components. Resources and information often must pass through these interfaces. The more boundaries, the more the complexity which means more cost, more time, and more coordination required.
Features of work help understanding whether the items create value or waste, and how they can affect the flow.
When you process a map, it will help you understand how to improve the work, how external and internal players add value, and how their relationships will be. It also acts as work architecture. A process map should be self-explanatory without using captions.
Flow is the property of work that corresponds to the resource transformation which takes place via value-creating activities.

7 principles to improve flow
- Improve Flow from the Outside-in
- Identify the item or work product that exits in the workflow
- Make sure the item is specific and is a countable result
- Determine who is the customer for that item or work product
- Find out what the customer values about that item
- Learn from the customer what the “nature of demand” is for the item
- Measure what Matters to the Customer
- Use measures related to the flow of the item.
- Measure the characteristics of flow that relate directly to what the customer values.
- Whenever possible, incorporate measures into the daily work, i.e., realtime integration into the workflow.
- Only collect data that you actually use.
- Use flow-centric measurement data as “real-time performance indicators,” the way you do the gauges on the dashboard while you are driving.
- Make the end-to-end Flow Visible
- Trace the actual path of the item, from the initial trigger to the point in the workflow where the customer receives the item.
- Identify the main resources involved along the path.
- Observe an item as it flows along the path; watch while the work is being done
- Select or define a method to literally make the (item) flow visible in the context of the workflow in which it occurs.
- Determine how this workflow relates to the organization’s primary workflow (order to delivery).
- Identify and Remove Barriers to Flow
- Identify the types of waste and any “barriers to flow” present
- Locate the points in the workflow where these occur
- Determine causes of the waste and why the barrier to flow exists
- Develop and implement an integrated set of countermeasures that address the causes and remove the barriers.
- Connect and align value-added work fragments
- Locate each value-creating activity
- Separate the work from the people and systems that currently do it
- Analyze the work content
- Examine alternative ways to do the work
- Assess the feasibility and implications of structuring the work and organizing the required resources in this way.
- Organize around the end to end flow
- Assign operational accountability and responsibility for the workflow as a whole.
- Deploy, operate, and connect the required resources (along the path) so they optimize flow with respect to customer demand.
- Manage the flow visually
- Explore ways that each member of the natural workgroup may view “flow” in real-time.
- Make it easy for each member to spot normal vs. abnormal operating conditions, in real-time.
- Provide information on item status, progress, problems, and performance measures to everyone throughout the workflow in real-time.
Bibliography:
The Basics of Process Mapping, Robert Damelio, Taylor & Francis, 1996
Downloads for Process Mapping:
You can also get an additional amount of interesting knowledge about this content. With our newsletter, you will get an efficient set of tools to learn a lot about topics focused on services & digital product building. Read more.


